
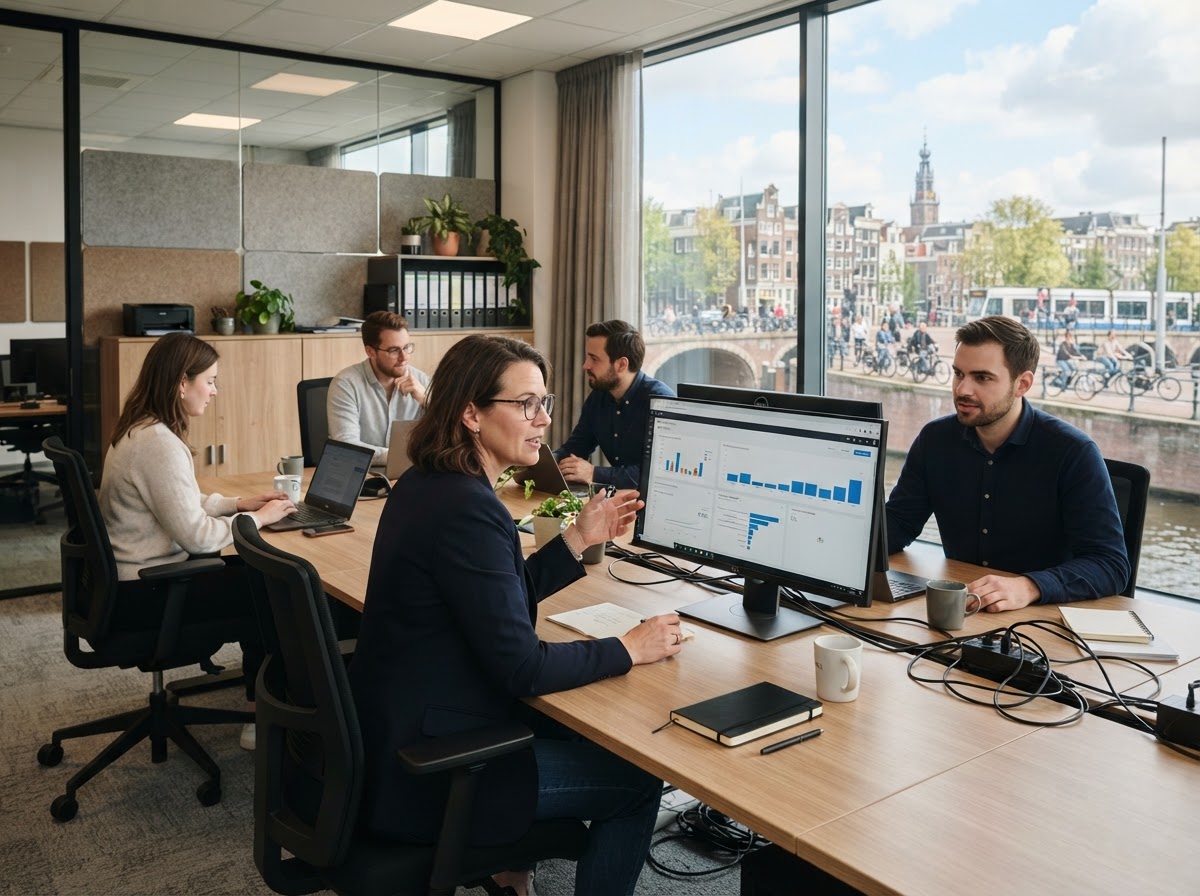
Nieuwsbron Nederland unified dashboard with real-time data analysis for investment decisions

Decisions based on data, not on gut feeling

Nieuwsbron Nederland links multiple trading platforms to one clear dashboard and uses predictive models to visualize deviations, risks and opportunities before you have to search through all the data yourself.

Start Analysis
Connected via secure, read-only API connections Continuous model validation on historical and current data One overview instead of separate platform screens
The challenge

The complexity of distributed market data is often underestimated

Anyone who is active on multiple platforms automatically collects multiple truths. Each platform shows its own prices, its own statistics and its own time delay.

  • Shredded screens. Data is spread across separate platform dashboards that do not communicate with each other.
  • Human interpretation errors. Manually comparing numbers in spreadsheets leads to delays and inconsistent conclusions.
  • Delayed reaction time. By the time anomalies are manually spotted, the relevant market movement has often already passed.
  • Insufficient risk awareness. Without aggregated data, it remains difficult to jointly assess exposure across multiple positions.
Recognizable image

A desk with four browser tabs open, each with a different platform, a separate notepad with manual calculations and a price update that arrives just as the previous one has not yet been processed.

The solution

One central overview for all linked platforms

Nieuwsbron Nederland platform in which multiple data sources come together in one dashboard view

The unified dashboard of Nieuwsbron Nederland collects data from linked platforms and processes it into one coherent overview. Instead of switching between screens, you see positions, price movements and risk indicators side by side, based on the same time basis.

The AI ​​analysis works in the background: it recognizes patterns across platforms and signals when the correlation between sources deviates from the historical average.

  • Real-time synchronization of multiple platform connections
  • Predictive models based on historical and current data
  • Risk scores per position and across the total portfolio
  • Notifications of deviations from the expected pattern
Method

How predictive models arrive at concrete advice

The underlying logic is composed of three consecutive steps, without hidden assumptions.

Step 1

Data aggregation

Price data, volumes and order book information from linked platforms are bundled into one consistent dataset, corrected for differences in time stamp and frequency.

Step 2

AI refinement

Models test the combined data against historical patterns and calculate probabilities, without making statements about guaranteed outcomes.

Step 3

Actionable insights

The outcome is translated into a concrete signal with associated risk indication, so that the user can make a well-founded decision.

Application in practice

Practical use for two different goals

Private investor

Passive income in addition to a permanent job

For those who work on wealth accumulation in addition to a regular job, time is the limiting factor. The dashboard assesses positions on multiple platforms simultaneously and only reports when an deviation actually requires attention, instead of having to continuously check manually.

Result: less time spent on monitoring, more overview of the total exposure.
Small business

Strategic planning and risk spreading

Small businesses that deploy cash reserves on multiple platforms use Nieuwsbron Nederland's risk scores to inform internal decision-making, rather than relying on separate platform reporting.

Result: substantiated distribution based on one shared dataset, usable in internal reporting.
Transparency

Technical clarity and risk information

The points below describe how the platform handles data and risk, without exaggerated guarantees.

How is platform data secured?

Links to external platforms are made via read-only API connections. This means that Nieuwsbron Nederland can read prices and portfolio data, but cannot place orders or move funds.

Which platforms is the dashboard compatible with?

The dashboard is built on a platform-independent connection structure, allowing multiple major trading platforms to be connected within the same environment. New links are added based on technical availability of the relevant API.

How is risk managed within the models?

Each signal is combined with a risk indication based on historical volatility and correlation between positions. This does not replace your own assessment, but makes the underlying risk assessment explicit instead of implicit.

Does the platform guarantee returns?

No. Predictive models work with probabilities based on historical patterns. Markets can deviate from historical patterns, so outcomes are never completely certain.

Access to the unified dashboard starts with one link

Connect an initial platform and see how the aggregated data and risk indicators compare to the separate platform view you are currently using.